
Keeping up with the latest media coverage on home prices can often be confusing. The confusion arises from the various data types and focal points chosen for attention. When it comes to understanding real estate prices, two commonly used methods are year-over-year (Y-O-Y) and month-over-month (M-O-M) comparisons. In this blog post, we will delve into the distinction between these approaches and shed light on their significance in the current market. So, let's get started!
Year-over-Year (Y-O-Y) Comparison
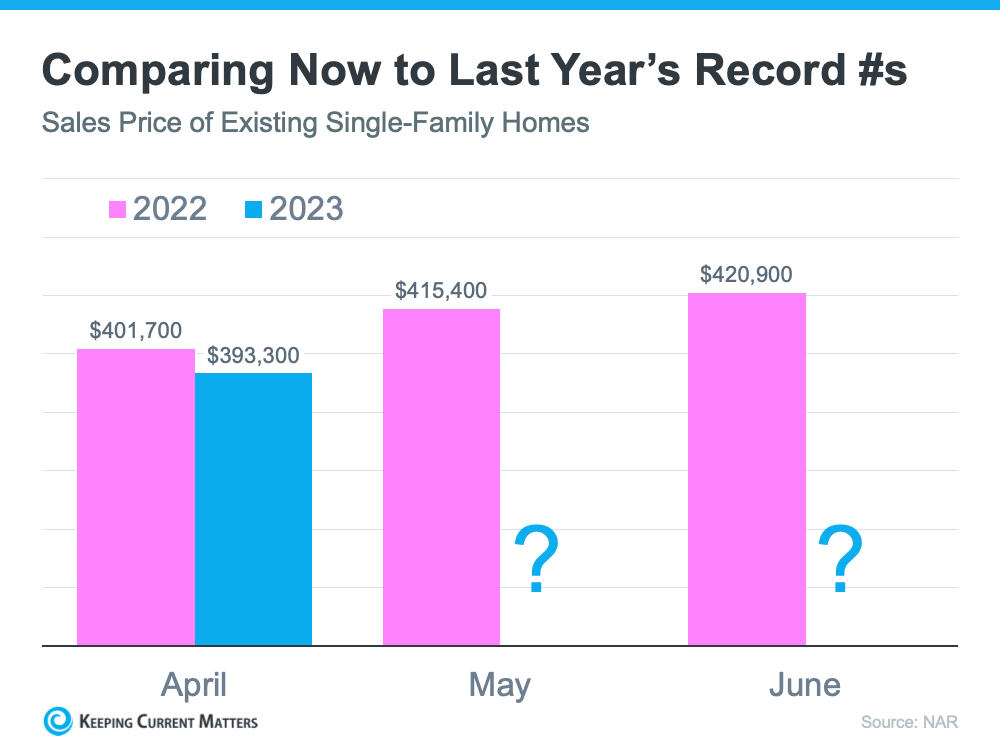
The Y-O-Y comparison measures changes in home prices by comparing the same month or quarter of the current year with the corresponding period from the previous year. For instance, if we analyze Y-O-Y home prices for April 2023, we would compare them with the prices recorded in April 2022. This method offers a broader perspective of long-term trends, making it useful for evaluating annual growth rates and determining whether the market is appreciating or depreciating.
Month-over-Month (M-O-M) Comparison
In contrast, the M-O-M comparison examines changes in home prices from one month to the next. For example, comparing M-O-M home prices for April 2023 would involve analyzing them relative to March 2023. M-O-M comparisons provide a more immediate snapshot of short-term movements and price fluctuations. They help track immediate shifts in demand and supply, identify seasonal trends, and gauge the impact of specific events on the housing market.
Understanding the Importance of the Distinction
The distinction between Y-O-Y and M-O-M comparisons becomes particularly significant in the current scenario. We are approaching a period when home prices could potentially be lower than they were in the same month the previous year. Specifically, April, May, and June of 2022 marked a peak in home prices in the history of the American housing market. However, this year's figures might not match up to those record-breaking months. Consequently, Y-O-Y comparisons are likely to show depreciation in home values, leading to headlines suggesting a decline in prices.
Analyzing M-O-M Trends
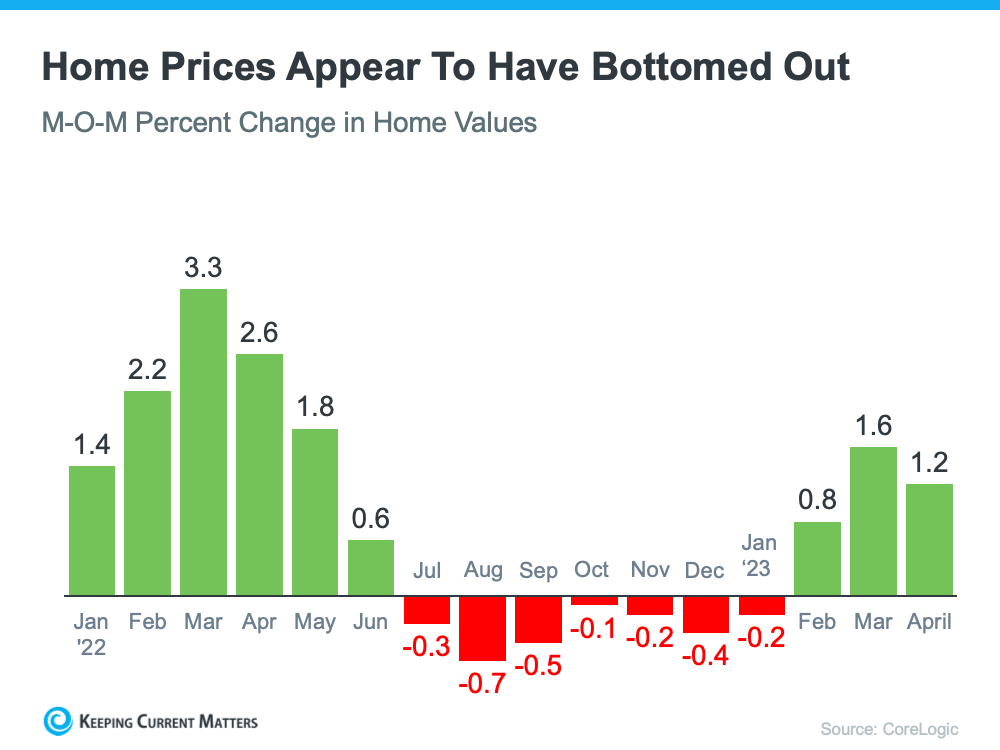
Fortunately, when we shift our focus to M-O-M home prices, a different story emerges. Over the past several months, home prices have been appreciating. These M-O-M numbers provide a more accurate reflection of the current state of home values. After a period of depreciation, it appears that we have hit the bottom and are now experiencing a rebound.
Visualizing M-O-M Home Price Movements
To visualize these trends, let's consider the M-O-M home price movements over the last 16 months, as shown in the CoreLogic Home Price Insights report. The graph depicts a consistent upward trajectory, indicating the resurgence of home prices.
The Relevance to Homebuyers: If you come across negative headlines about home prices, it's essential to remember that they may not portray the complete picture. In the upcoming months, the comparison will be made against last year's peak prices, which can create a negative perception through Y-O-Y analysis. However, by considering the M-O-M trends, we can observe that home prices are actually on the rise.
This presents a unique advantage for prospective homebuyers. Buying a home now offers the opportunity to purchase at a discounted price compared to the previous year, while also benefiting from the momentum of increasing prices. It's referred to as "buying at the bottom," and it can be a strategic move.
Conclusion
Understanding real estate market updates, especially when it comes to home prices, requires careful analysis of Y-O-Y and M-O-M comparisons. While Y-O-Y comparisons may indicate depreciation due to record-breaking prices last year, M-O-M trends paint a more optimistic picture of a rebound in home values. If you have any questions about the current state of home prices or are considering purchasing a property, it's advisable to connect with a local real estate agent who can provide personalized guidance.
Remember, staying informed about real estate market updates empowers you to make well-informed decisions in the dynamic world of real estate.